Market Outlook
February 27, 2018
Market Cues
Domestic Indices
Chg (%)
(Pts)
(Close)
Indian markets are likely to open positive tracking global indices and SGX Nifty.
BSE Sensex
0.9
304
34,446
US stocks moved sharply higher over the course of the trading session. With the
Nifty
0.9
92
10,583
continued strength on the day, the major averages further offset the sell-off seen
Mid Cap
0.7
123
16,685
earlier this month.The Dow Jones ended on an upside front of 1.6% to close at
Small Cap
0.9
158
18,154
25,709 and the Nasdaq Composite edged up to 1.1%, to 7,421.
Bankex
1.6
466
29,002
U.K. shares were off their day's highs after Bank of England Deputy Governor Dave
Ramsden said in an interview with the Sunday Times the U.K. interest rates are likely
Global Indices
Chg (%)
(Pts)
(Close)
to rise somewhat sooner rather than later, if wage growth improves. The FTSE 100
Dow Jones
1.6
399
25,709
was ended on an upside front of 0.6% at 7,290.
Nasdaq
1.1
84
7,421
On domestic front, Indian shares rose for a second straight session as investors
FTSE
0.6
45
7,290
brushed aside worries over the Rs 11,300-crore fraud case at Punjab National Bank
Nikkei
1.4
309
22,462
and looked ahead to key macroeconomic data due this week for direction. The
Hang Seng
0.2
52
31,550
Sensex ended on an upside front of 0.9% at 34,446 while the Nifty ended at 10,583
Shanghai Com
(0.8)
(26)
3,304
with an upside of 0.9%.
News Analysis
Advances / Declines
BSE
NSE
Aster DM Healthcare Ltd IPO listing Review
Advances
1,598
1,075
Declines
1,195
738
Detailed analysis on Pg2
Unchanged
168
60
Investor’s Ready Reckoner
Key Domestic & Global Indicators
Volumes (` Cr)
Stock Watch: Latest investment recommendations on 150+ stocks
BSE
3,459
Refer Pg5 onwards
NSE
28,998
Top Picks
CMP
Target
Upside
Net Inflows (` Cr)
Net
Mtd
Ytd
Company
Sector
Rating
(`)
(`)
(%)
FII
852
(8,783)
4,201
Blue Star
Capital Goods
Buy
742
867
16.9
Dewan Housing Finance
Financials
Buy
582
712
22.3
*MFs
806
10,111
19,134
Century Plyboards
Forest Products
Buy
326
400
22.8
Navkar Corporation
Other
Buy
169
265
56.8
Top Gainers
Price (`)
Chg (%)
KEI Industries
Capital Goods Accumulate
380
436
14.7
OBEROIRLTY
559
16.2
More Top Picks on Pg4
CHAMBLFERT
170
8.3
Key Upcoming Events
RCOM
30
8.0
Previous
Consensus
Date
Region
Event Description
KEC
428
6.9
Reading
Expectations
Feb27
Euro Zone Euro-Zone Consumer Confidence
0.10
0.10
PIIND
897
6.6
Feb27
Germany Unemployment change (000's)
(24.00)
(15.00)
Feb28
US
Consumer Confidence
125.40
126.40
Top Losers
Price (`)
Chg (%)
Feb28
China
PMI Manufacturing
51.30
51.20
ORIENTBANK
95
(10.0)
Feb28
Germany
PMI Manufacturing
60.30
60.30
More Events on Pg7
VAKRANGEE
181
(5.0)
JPASSOCIAT
18
(4.7)
SPARC
439
(4.0)
VIDEOIND
16
(3.6)
As on February 26 2018
Market Outlook
February 27, 2018
News Analysis
Aster DM Healthcare Ltd IPO listing Review
Aster DM Healthcare Ltd (ADHL) is one of the largest private healthcare service
providers which operates in multiple GCC states and is an emerging healthcare
player in India.
In terms of valuations, the pre-issue EV/EBITDA works out to 32.5x its 1HFY2018
annualized EBITDA (at the upper end of the issue price band), which is higher
compared to its peers like Apollo Hospitals Enterprise (trading at PE 22.3x -
1HFY2018 annualized EBITDA). On EV/ Bed basis, ADHL is `2.4cr v/s Apollo
Hospitals Enterprise’s `1.7cr. Further, last three years’ financial performance
including 1HFY18 numbers doesn’t provide confidence. While the shares of ADHL
listed around IPO price, yesterday it closed 5.34% down to `179.
Economic and Political News
ED seeks Letters Rogatory to probe Nirav Modi's overseas business, assets
CPI inflation to trend higher; chances of rate hike rising
GVA growth likely to improve to 6.8 per cent in Q3 led by services
Corporate News
NLC's 3,200 Mw Odisha project at stake on power allocation issues
RIL-BP's $4bn plan for developing 3 sets of discoveries in KG-D6 approved
Reliance Jio and Samsung to set up nationwide Internet of Things network
RInfra wins Rs 2.92bn arbitration with Goa government over non-payment
of dues
Market Outlook
February 27, 2018
Top Picks
Market Cap
CMP
Target
Upside
Company
Rationale
(` Cr)
(`)
(`)
(%)
Strong growth in domestic business due to its leade`hip
in acute therapeutic segment. Alkem expects to launch
Alkem Laboratories
26,442
2,212
2,441
10.4
more products in USA, which bodes for its international
business.
Favorable outlook for the AC industry to augur well for
Cooling products business which is out pacing the
Blue Star
7,119
742
867
16.9
market growth. EMPPAC division's profitability to
improve once operating environment turns around.
With a focus on the low and medium income (LMI)
consumer segment, the company has increased its
Dewan Housing Finance
18,267
582
712
22.3
presence in tier-II & III cities where the growth
opportunity is immense.
Loan growth is likely to pick up after a sluggish FY17.
Lower credit cost will help in strong bottom-line growth.
Karur Vysya Bank
8,020
110
160
44.9
Increasing share of CASA will help in NIM
improvement.
High order book execution in EPC segment, rising B2C
KEI Industries
2,980
380
436
14.7
sales and higher exports to boost the revenues and
profitability
Expected to benefit from the lower capex requirement
Music Broadcast
2,179
382
475
24.3
and 15 year long radio broadcast licensing.
Massive capacity expansion along with rail advantage
Navkar Corporation
2,544
169
265
56.8
at ICD as well CFS augur well for the company
Strong brands and distribution network would boost
Siyaram Silk Mills
3,047
650
851
30.9
growth going ahead. Stock currently trades at an
inexpensive valuation.
Market leadership in Hindi news genre and no.
2
viewership ranking in English news genre, exit from the
TV Today Network
2,716
455
508
11.6
radio business, and anticipated growth in ad spends by
corporate to benefit the stock.
After GST, the company is expected to see higher
volumes along with improving product mix. The Gujarat
Maruti Suzuki
2,71,926
9,002
10,619
18.0
plant will also enable higher operating leverage which
will be margin accretive.
We expect loan book to grow at 24.3% over next two
GIC Housing
2,185
406
655
61.4
year; change in borrowing mix will help in NIM
improvement
We expect CPIL to report net Revenue/PAT CAGR of
~17%/16% over FY2017-20E mainly due to healthy
7,237
326
400
22.8
growth in plywood & lamination business, forayed into
Century Plyboards India
MDF & Particle boards on back of strong brand &
distribution network.
We expect sales/PAT to grow at 13.5%/20% over next
LT Foods
3,045
95
128
34.5
two years on the back of strong distribution network &
addition of new products in portfolio.
We expect financialisation of savings and increasing
Aditya Birla Capital
36118
164
230
39.0
penetration in Insurance & Mutual fund would ensure
steady growth.
Third largest brand play in luggage segment Increased
product offerings and improving distribution network is
Safari Industries
1180
530
650
22.4
leading to strong growth in business. Likely to post
robust growth for next 3-4 years
We expect HSIL to report PAT CAGR of ~15% over
FY2017-20E owing to better improvement in operating
HSIL
3094
428
510
19.1
margin due price hike in container glass segment,
turnaround in consumer business.
Source: Company, Angel Research
Market Outlook
February 27, 2018
Fundamental Call
Market Cap
CMP
Target
Upside
Company
Rationale
(` Cr)
(`)
(`)
(%)
CCL is likely to maintain the strong growth trajectory
CCL Products
3,911
294
360
22.4
over FY18-20 backed by capacity expansion and new
geographical foray
We forecast Nilkamal to report top-line CAGR of ~9%
to `2,635cr over FY17-20E on the back of healthy
Nilkamal
2,529
1,695
2,178
28.5
demand growth in plastic division. On the bottom-line
front, we estimate ~10% CAGR to `162cr owing to
improvement in volumes.
We expect sales/PAT to grow at 9%/14% over next two
years on the back of healthy demand growth in
Shreyans Industries
222
160
247
53.9
printing. Further, China had banned making paper
from waste pulp which would benefit Indian paper
companies.
The prism has diversified exposure in the different
segment such as Cement, Tile & ready mix concrete.
Prism Cement
6,410
127
160
25.6
Thus we believe, PCL is in the right place to capture
ongoing government spending on affordable housing
and infrastructure projects.
Source: Company, Angel Research
Market Outlook
February 27, 2018
Key Upcoming Events
Global economic events release calendar
Bloomberg Data
Date
Time Country
Event Description
Unit
Period
Last Reported
Estimated
Feb 27, 2018
3:30 PMEuro Zone
Euro-Zone Consumer Confidence
Value
Feb F
0.10
0.10
2:25 PMGermany
Unemployment change (000's)
Thousands
Feb
(24.00)
(15.00)
Feb 28, 2018
8:30 PMUS
Consumer Confidence
S.A./ 1985=100
Feb
125.40
126.40
6:30 AMChina
PMI Manufacturing
Value
Feb
51.30
51.20
2:25 PMGermany
PMI Manufacturing
Value
Feb F
60.30
60.30
Mar 01, 2018
7:00 PMUS
GDP Qoq (Annualised)
% Change
4Q S
2.60
2.50
7:00 PMUS
Initial Jobless claims
Thousands
Feb 24
222.00
226.00
3:00 PMUK
PMI Manufacturing
Value
Feb
55.30
55.00
Mar 05, 2018
2:25 PMGermany
PMI Services
Value
Feb F
55.30
Mar 07, 2018
3:30 PMEuro Zone
Euro-Zone GDP s.a. (QoQ)
% Change
4Q F
0.60
Mar 08, 2018
China
Exports YoY%
% Change
Feb
11.10
6:15 PMEuro Zone
ECB announces interest rates
%
Mar 8
-
Mar 09, 2018
3:00 PMUK
Industrial Production (YoY)
% Change
Jan
-
7:00 AMChina
Consumer Price Index (YoY)
% Change
Feb
1.50
7:00 PMUS
Change in Nonfarm payrolls
Thousands
Feb
200.00
195.00
7:00 PMUS
Unnemployment rate
%
Feb
4.10
4.00
Mar 12, 2018
6:00 PMUS
Consumer price index (mom)
% Change
Feb
0.50
Mar 13, 2018
5:30 PMIndia
Industrial Production YoY
% Change
Jan
7.10
Mar 14, 2018
12:00 PMIndia
Monthly Wholesale Prices YoY%
% Change
Feb
2.84
US
Producer Price Index (mom)
% Change
Feb
0.70
Mar 15, 2018
India
Imports YoY%
% Change
Feb
26.10
India
Exports YoY%
% Change
Feb
9.10
Mar 16, 2018
3:30 PMEuro Zone
Euro-Zone CPI (YoY)
%
Feb F
1.30
6:45 PMUS
Industrial Production
%
Feb
(0.05)
Source: Bloomberg, Angel Research
Market Outlook
February 27, 2018
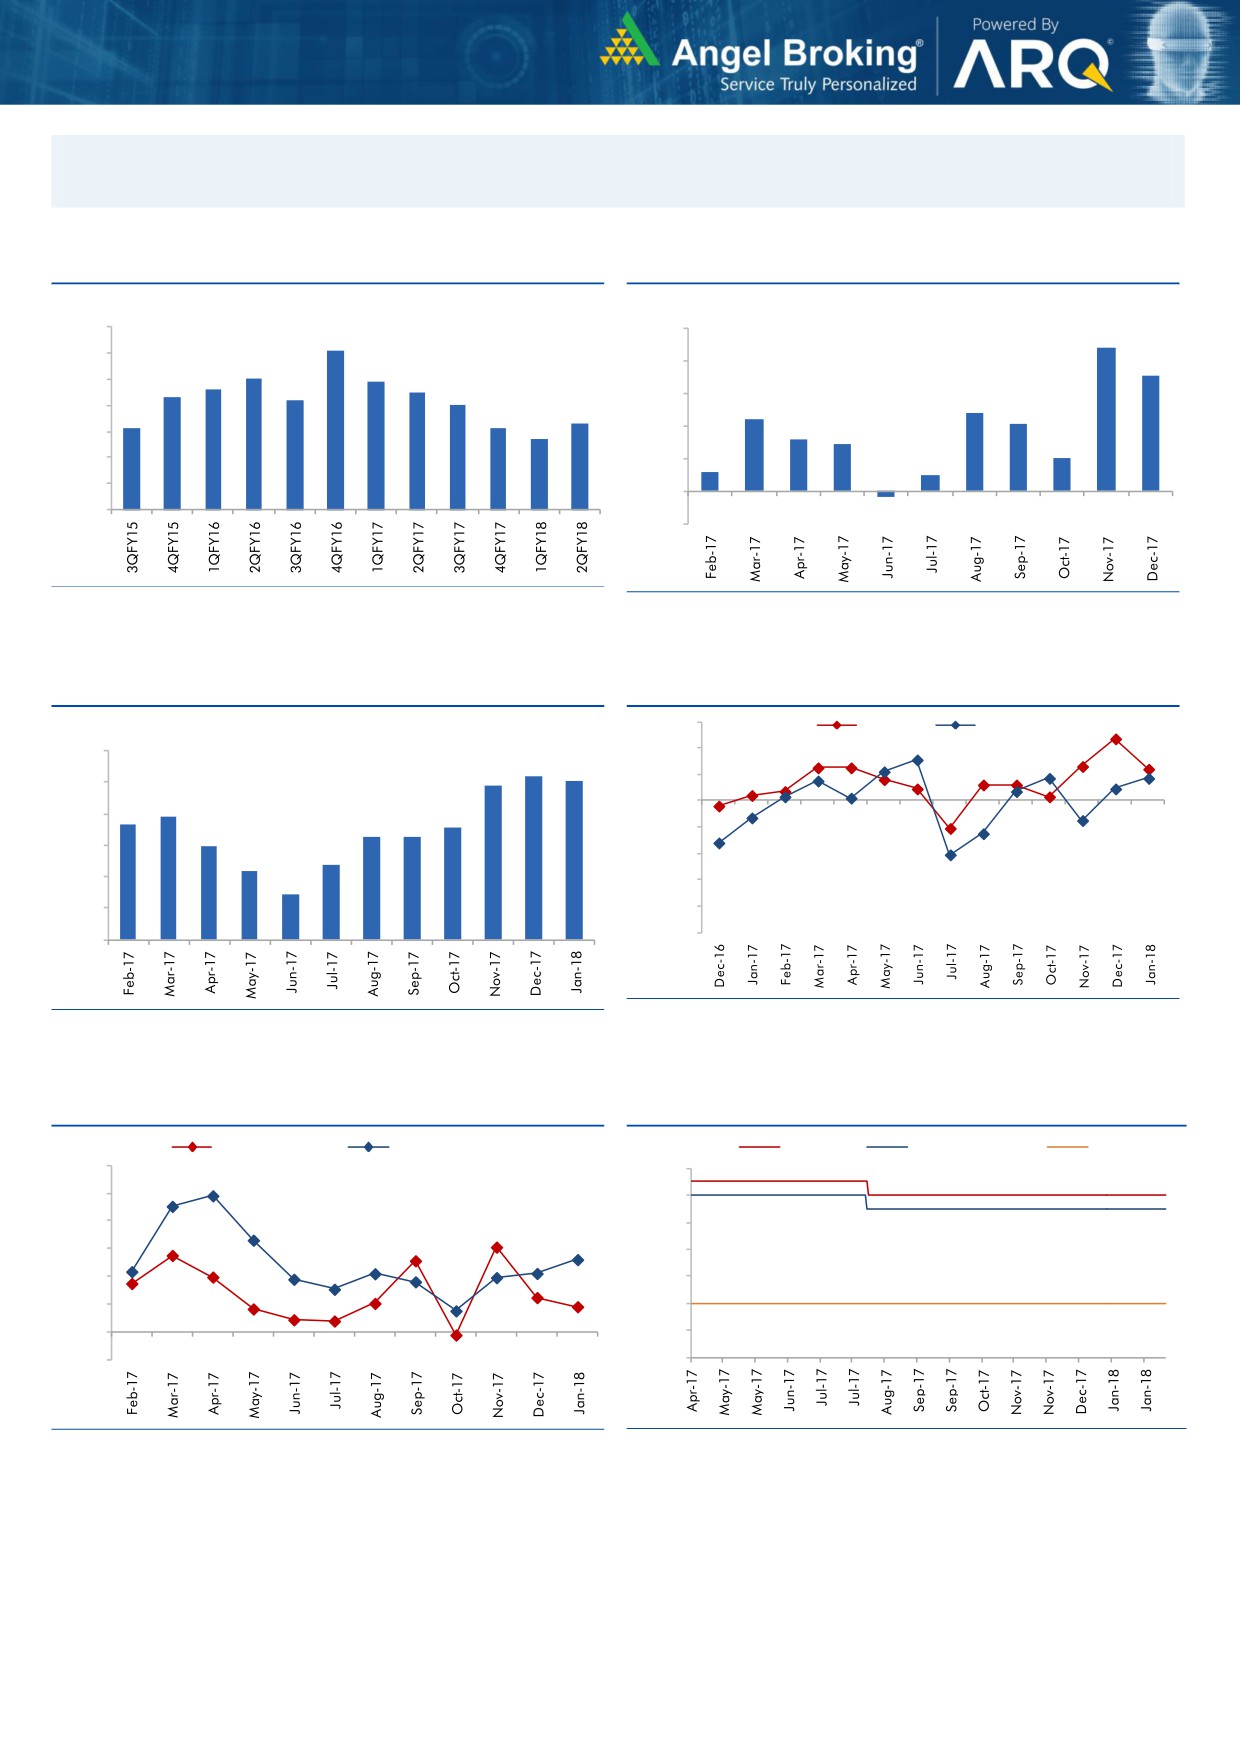
Macro watch
Exhibit 1: Quarterly GDP trends
Exhibit 2: IIP trends
(%)
(%)
10.0
10.0
9.1
8.8
9.0
8.0
7.1
8.0
7.9
7.6
7.5
8.0
7.3
7.2
7.0
6.0
4.8
7.0
6.3
4.4
4.1
6.1
6.1
5.7
4.0
3.2
2.9
6.0
2.0
5.0
2.0
1.2
1.0
4.0
-
3.0
(0.3)
(2.0)
Source: CSO, Angel Research
Source: MOSPI, Angel Research
Exhibit 3: Monthly CPI inflation trends
Exhibit 4: Manufacturing and services PMI
56.0
Mfg. PMI
Services PMI
(%)
6.0
54.0
5.2
5.1
4.9
52.0
5.0
3.9
50.0
3.7
3.6
4.0
3.3
3.3
3.0
48.0
3.0
2.4
2.2
46.0
2.0
1.5
44.0
1.0
42.0
40.0
-
Source: Market, Angel Research; Note: Level above 50 indicates expansion
Source: MOSPI, Angel Research
Exhibit 5: Exports and imports growth trends
Exhibit 6: Key policy rates
(%)
Exports yoy growth
Imports yoy growth
(%)
Repo rate
Reverse Repo rate
CRR
60.0
6.50
50.0
6.00
40.0
5.50
30.0
5.00
20.0
4.50
10.0
4.00
0.0
3.50
(10.0)
3.00
Source: Bloomberg, Angel Research
Source: RBI, Angel Research
Market Outlook
February 27, 2018
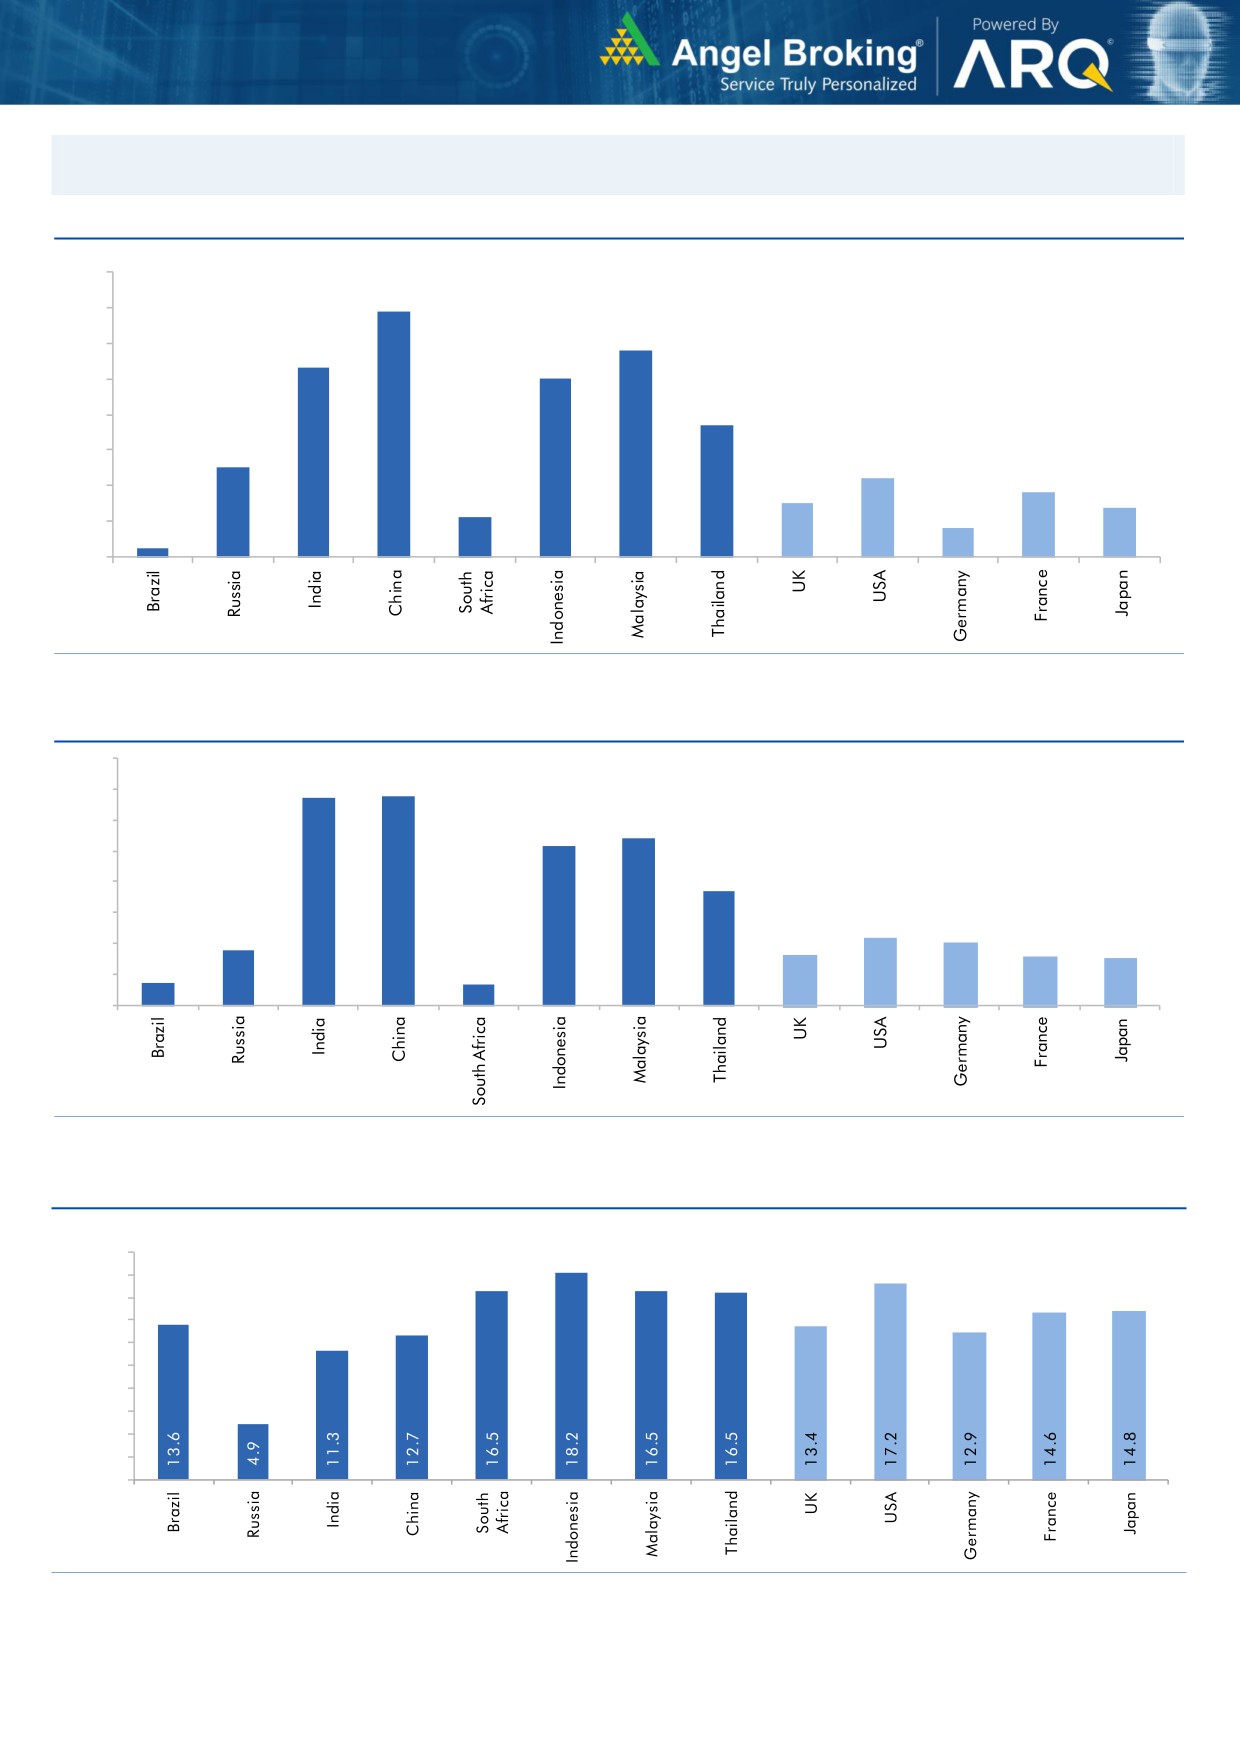
Global watch
Exhibit 1: Latest quarterly GDP Growth (%, yoy) across select developing and developed countries
(%)
8.0
6.9
7.0
5.8
6.0
5.3
5.0
5.0
1.1
3.7
4.0
2.5
3.0
2.2
1.8
2.0
1.5
1.4
0.8
1.0
0.3
-
Source: Bloomberg, Angel Research
Exhibit 2: 2017 GDP Growth projection by IMF (%, yoy) across select developing and developed countries
(%)
6.7
6.8
7.0
6.0
5.4
5.2
5.0
3.7
4.0
3.0
1.8
2.2
2.0
1.7
1.6
2.0
0.7
1.5
0.7
1.0
-
Source: IMF, Angel Research
Exhibit 3: One year forward P-E ratio across select developing and developed countries
(x)
20.0
18.0
16.0
14.0
12.0
10.0
8.0
6.0
4.0
2.0
-
Source: IMF, Angel Research
Market Outlook
February 27, 2018
Exhibit 4: Relative performance of indices across globe
Returns (%)
Country
Name of index
Closing price
1M
3M
1YR
Brazil
Bovespa
87,653
7.3
19.4
28.9
Russia
Micex
2,353
2.0
8.9
12.4
India
Nifty
10,583
(4.5)
2.3
18.8
China
Shanghai Composite
3,330
(5.3)
(3.1)
3.2
South Africa
Top 40
51,861
(4.9)
(4.0)
15.0
Mexico
Mexbol
48,463
(4.5)
0.6
3.0
Indonesia
LQ45
1,093
(1.7)
8.2
23.0
Malaysia
KLCI
1,860
1.5
8.2
8.9
Thailand
SET 50
1,206
2.1
10.4
22.0
USA
Dow Jones
25,709
(2.1)
9.0
23.4
UK
FTSE
7,290
(4.3)
(1.7)
0.4
Japan
Nikkei
22,154
(7.5)
(0.5)
15.2
Germany
DAX
12,527
(5.8)
(3.7)
6.0
France
CAC
5,344
(2.5)
(0.7)
7.7
Source: Bloomberg, Angel Research p68in4
Market Outlook
February 27, 2018
Research Team Tel: 022 - 39357800
DISCLAIMER
Angel Broking Private Limited (hereinafter referred to as “Angel”) is a registered Member of National Stock Exchange of India
Limited,Bombay Stock Exchange Limited and Metropolitan Stock Exchange Limited. It is also registered as a Depository Participant with
CDSL and Portfolio Manager with SEBI. It also has registration with AMFI as a Mutual Fund Distributor. Angel Broking Private Limited is a
registered entity with SEBI for Research Analyst in terms of SEBI (Research Analyst) Regulations, 2014 vide registration number
INH000000164. Angel or its associates has not been debarred/ suspended by SEBI or any other regulatory authority for accessing
/dealing in securities Market. Angel or its associates/analyst has not received any compensation / managed or
co-managed public offering of securities of the company covered by Analyst during the past twelve months.
This document is solely for the personal information of the recipient, and must not be singularly used as the basis of any investment
decision. Nothing in this document should be construed as investment or financial advice. Each recipient of this document should make
such investigations as they deem necessary to arrive at an independent evaluation of an investment in the securities of the companies
referred to in this document (including the merits and risks involved), and should consult their own advisors to determine the merits and
risks of such an investment.
Reports based on technical and derivative analysis center on studying charts of a stock's price movement, outstanding positions and
trading volume, as opposed to focusing on a company's fundamentals and, as such, may not match with a report on a company's
fundamentals. Investors are advised to refer the Fundamental and Technical Research Reports available on our website to evaluate the
contrary view, if any.
The information in this document has been printed on the basis of publicly available information, internal data and other reliable
sources believed to be true, but we do not represent that it is accurate or complete and it should not be relied on as such, as this
document is for general guidance only. Angel Broking Pvt. Limited or any of its affiliates/ group companies shall not be in any way
responsible for any loss or damage that may arise to any person from any inadvertent error in the information contained in this report.
Angel Broking Pvt. Limited has not independently verified all the information contained within this document. Accordingly, we cannot
testify, nor make any representation or warranty, express or implied, to the accuracy, contents or data contained within this document.
While Angel Broking Pvt. Limited endeavors to update on a reasonable basis the information discussed in this material, there may be
regulatory, compliance, or other reasons that prevent us from doing so.
This document is being supplied to you solely for your information, and its contents, information or data may not be reproduced,
redistributed or passed on, directly or indirectly.
Neither Angel Broking Pvt. Limited, nor its directors, employees or affiliates shall be liable for any loss or damage that may arise from
or in connection with the use of this information.